Day 4-8 Severe Weather Outlook Issued on Feb 24, 2017
Updated: Fri Feb 24 09:59:03 UTC 2017
Day 4 Risk
Area (sq. mi.)
Area Pop.
Some Larger Population Centers in Risk Area
No Risk Areas Forecast
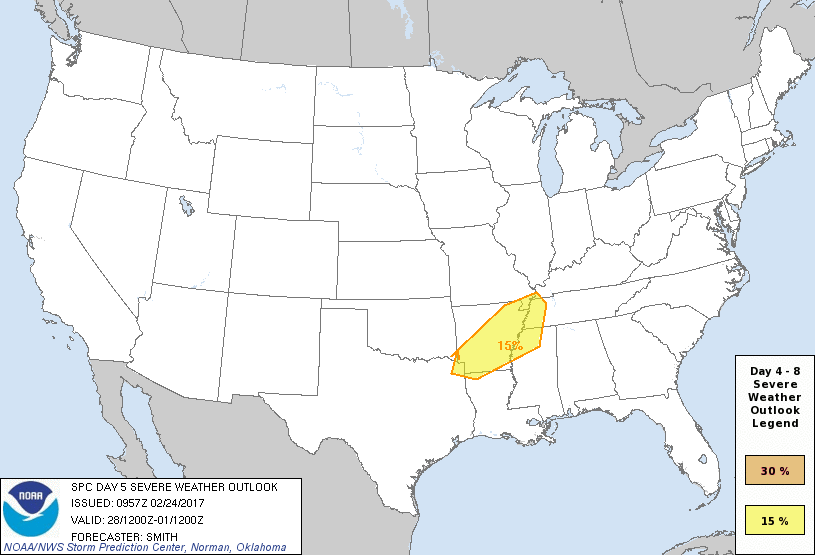
Day 5 Risk
Area (sq. mi.)
Area Pop.
Some Larger Population Centers in Risk Area
15 %
56,465
3,956,528
Memphis, TN...Little Rock, AR...Jackson, TN...North Little Rock, AR...Jonesboro, AR...
Day 6 Risk
Area (sq. mi.)
Area Pop.
Some Larger Population Centers in Risk Area
No Risk Areas Forecast
Day 7 Risk
Area (sq. mi.)
Area Pop.
Some Larger Population Centers in Risk Area
No Risk Areas Forecast
Day 8 Risk
Area (sq. mi.)
Area Pop.
Some Larger Population Centers in Risk Area
No Risk Areas Forecast
D4
Mon, Feb 27, 2017 - Tue, Feb 28, 2017
D7
Thu, Mar 02, 2017 - Fri, Mar 03, 2017
D5
Tue, Feb 28, 2017 - Wed, Mar 01, 2017
D8
Fri, Mar 03, 2017 - Sat, Mar 04, 2017
D6
Wed, Mar 01, 2017 - Thu, Mar 02, 2017
(All days are valid from 12 UTC - 12 UTC the following day)
Note: A severe weather area depicted in the Day 4-8 period indicates 15%, 30% or higher probability for severe thunderstorms within 25 miles of any point.
PREDICTABILITY TOO LOW is used to indicate severe storms may be possible based on some model scenarios. However, the location or occurrence of severe storms are in doubt due to: 1) large differences in the deterministic model solutions, 2) large spread in the ensemble guidance, and/or 3) minimal run-to-run continuity.
POTENTIAL TOO LOW means the threat for a regional area of organized severe storms appears unlikely (i.e., less than 15%) for the forecast day.
Forecast Discussion
   ZCZC SPCSWOD48 ALL
   ACUS48 KWNS 240957
   SPC AC 240957

   Day 4-8 Convective Outlook
   NWS Storm Prediction Center Norman OK
   0357 AM CST Fri Feb 24 2017

   Valid 271200Z - 041200Z

   ...DISCUSSION...
   The upper pattern for the extended period will feature a large-scale
   trough over the western U.S. which will move downstream into the
   central U.S. on Tuesday (Day 5) and into the Great Lakes/Northeast
   on Wednesday (Day 6).  Following this disturbance, northwest flow
   from the Canadian prairie provinces and offshore flow over the
   central Gulf states will result in low potential for severe
   thunderstorms for Thursday-Friday (Days 7-8).  There is some risk
   for severe thunderstorms beginning on Monday (Day 4) over the
   central Gulf Coast states but the timing and low-amplitude character
   of the disturbances which would influence thunderstorm development
   remains uncertain at this time.

   The 24/00z GFS appears to be an outlier in the timing of the
   ejecting mid-level disturbance compared to the 24/00z ECMWF, CMC,
   and UKMET deterministic models by 12 hours.  The 24/00z MREF
   ensemble consensus agreed more with the ECMWF, CMC, and UKMET in
   timing of the impulse.  Several days of return flow, coupled with
   steepening lapse rates over the southern Great Plains and strong
   shear, suggest severe thunderstorms are possible.  Greater
   confidence in the potential for a concentrated area of severe
   thunderstorms seems to be centered on Tuesday and Tuesday night (Day
   5) over AR and portions of the lower MS Valley.

   ..Smith.. 02/24/2017

   CLICK TO GET WUUS48 PTSD48 PRODUCT


 @NWSSPC