
NOAA/NWS Storm Prediction Center, Norman, Oklahoma
An overview of conditions associated with the Oklahoma-Kansas tornado outbreak of 3 May 1999 is presented, with emphasis on the evolution of environmental and supercellular characteristics most relevant to the prediction of violent tornado episodes. This examination provides a unique perspective of the event by combining analyses of remote observational data and numerical guidance with direct observations of the event in the field by forecasters and other observers. The 3 May 1999 outbreak included two prolific supercells which produced several violent tornadoes, with ambient parameters comparable to those of past tornado outbreaks in the southern and central Great Plains. However, not all aspects leading to the evening of 3 May unambiguously favored a major tornado outbreak. The problems that faced operational forecasters at the Storm Prediction Center are discussed in the context of this outbreak, including environmental shear and instability, subtle processes contributing to convective initiation, the roles of preexisting boundaries, and storm-relative flow. This examination reveals several specific aspects where conceptual models are deficient and/or additional research is warranted.
During the late afternoon and evening hours of 3 May 1999, a violent tornado outbreak affected portions of central and northern Oklahoma, and southern Kansas. A total of 68 tornadoes were documented from the ten tornadic supercells (Fig. 1a) which developed over the southern Plains that afternoon and evening (NOAA 1999). [NOTE: Revisions by Speheger et al, 2001 have since combined tornadoes B20 and B21, revising the tally down from 69. Other tornado-producing thunderstorms occurred well after 0600 UTC 4 May 1999, but those events were not a direct continuation of the afternoon and evening outbreak and are not included here.] Long-lived, violent (F4-F5 damage) tornadoes occurred in the Oklahoma City, Oklahoma and Wichita, Kansas metropolitan areas, as well as in the small towns of Mulhall and Dover to the north and northwest of Oklahoma City. The number of strong and violent tornadoes on 3 May 1999 was comparable to that of 26 April 1991, the most recent major tornado outbreak to affect Oklahoma and Kansas. The environmental buoyancy and shear profiles on 3 May resembled those of several violent Oklahoma tornado events in the past two decades.

However, the 3 May case presented several difficult forecast problems. Surface plots of observations from the Oklahoma mesonet (Brock et al. 1995) showed that the initial supercell developed to the east of two weakly convergent drylines, and west of a subtle confluence axis located across southern and central Oklahoma. A thick cirrus overcast reduced heating and boundary layer mixing near and west of the drylines through much of the afternoon. High clouds are generally viewed as a hindrance to convective initiation during the warm season in the Great Plains. However, the initial supercell developed within a break in the thick cirrus overcast, where observed and model forecast soundings suggested that surface temperatures were sufficiently warm to minimize convective inhibition. Additionally, the evolution of the middle- and upper-tropospheric flow was not forecast well by the 00 and 12 UTC 3 May 1999 operational models prior to the outbreak. National Demonstration Profiler Network time series (locations mapped in Fig. 1b) revealed the progression of a well-defined jet streak 4-10 km above ground level from eastern New Mexico and western Texas during the late morning of 3 May to western and central Oklahoma that evening. The upper-tropospheric jet streak contributed to greater deep-layer vertical shear than forecast by the operational models, and may have been accompanied by weak large-scale ascent over western Oklahoma during the afternoon.
The intent here is to document the environment and evolution of the 3 May 1999 tornado outbreak from the view of operational forecasters. Field observations by the authors, and other observers, augment the documentation of several tornadic supercells in the outbreak. We believe this unique perspective offers the opportunity to describe the event from the synoptic scale down to the storm scale, and to focus attention on the difficulties faced by operational severe storm forecasters regarding convective initiation and morphology. It is hoped that concerns raised by this study can help focus future severe storm research, with the goal of benefitting operational convective outlooks, watches, and warnings.
The evolution of the synoptic-scale environment is presented in section 2, with specific emphasis on the distributions of moisture, instability, and vertical wind shear. Convective initiation and the morphologies of the individual tornadic supercells are addressed in section 3. Section 4 discusses typical and atypical aspects of the 3 May 1999 event, while section 5 summarizes the important aspects of this major regional tornado outbreak and directs attention to the most critical operational forecast concerns in its wake.
A mean large-scale trough was located over the western United States at 12 UTC 3 May (Fig. 2a), with an embedded short wave trough over Arizona. The large-scale trough amplified over the Rockies by 00 UTC 4 May, while the embedded short wave trough progressed from Arizona to western Oklahoma and Kansas (Figs. 2b and 6e). In association with this deepening mid-level trough and southwesterly flow over the southern and central Rockies, a deepening surface low was located over the central high Plains, with low-level south to southeast flow in the warm sector over Kansas, Oklahoma, and Texas.


A sequence of 3 May surface analyses and data plots that preceded the tornado outbreak is shown in Fig. 3. Surface dew points in the middle-to-upper 60s F (18-20 C) spread northward from central Texas at 00 UTC (Fig. 3a), to central Oklahoma by 12 UTC (Fig. 3b), and southern Kansas by 20 UTC (Fig. 3c). Figure 3d provides a mesoscale view of surface conditions at 20 UTC in proximity to the initiation of storms A and B, roughly 30 minutes prior to the earliest deep convection that can be traced to storm A. Diffuse drylines were analyzed along the moist side of two moisture gradients resolvable in Oklahoma mesonet data. The western boundary denoted what has been traditionally considered the dryline (e.g., Schaefer 1974; Doswell 1982). The moisture gradient across the eastern boundary was weaker than typically observed with a dryline (e.g., a dew point change of 10 F or more between observing stations, after Schaefer 1974), though the small range of dew points (roughly 58-61 F) between the two analyzed boundaries was supportive of two transition zones in the surface moisture field. The diffuse boundary structures in Fig. 3 apparently were less important than the fact that dew points had increased to the upper 60s F (~20 C) and surface temperatures had warmed to the middle 80s F (~30 C) by 20 UTC in extreme southwestern Oklahoma, which contributed to very large CAPE values and weak convective inhibition (Fig. 4).


The 12 UTC Norman (OUN) sounding (Fig. 5, background) revealed a moist boundary layer about 1 km deep, beneath an elevated mixed layer located from about 825-600 mb. A special 18 UTC sounding from OUN (not shown) revealed some deepening of the boundary layer from 12-18 UTC, with 2-3 C warming between 700 and 500 mb. The 00 UTC 4 May OUN sounding (Fig. 5, foreground) indicated substantial (2-4 C) warming from 600 mb to the surface during the previous 12 hours, with the majority of the warming from 18-00 UTC confined to the 850-750 mb layer.

Boundary layer depth did not increase substantially after 18 UTC, although the magnitude of boundary layer dew points did increase by about 2 C. Soundings from Fort Worth, Texas (FWD, not shown) revealed low-level warming and moistening similar to that observed at Norman. Both the 18 UTC and 00 UTC OUN soundings, modified for surface conditions in proximity to the initial stages of storm A (temperature of 29.5 C and dew point of 20.5 C ), yielded a mean boundary layer based CAPE near 5000 J kg-1, with less than 10 J kg-1 convective inhibition. These CAPE and convective inhibition values were in good agreement with short term model soundings for southwestern Oklahoma. The unmodified mean CAPE in the 00 UTC OUN sounding was about 2200 J kg-1, with a convective inhibition near 100 J kg-1, although the truncated sounding did not allow a complete estimate of CAPE. The moist profile above 500 mb in the 00 UTC sounding denotes rawinsonde penetration of the anvil of storm A while that storm was producing tornadoes about 25 miles to the west-southwest of Norman.
As destabilization continued over the southern Plains, an upper-tropospheric jet streak moved east-northeastward over Arizona and New Mexico from the mean trough position over the western United States. Although the magnitude of this jet streak was not well-resolved in the 12 UTC 3 May soundings, a much clearer indication of the strength of the speed maximum was provided by several profilers during the day. Time-height series of profiler winds at Tucumcari, New Mexico from 11-16 UTC on 3 May (Fig. 6a), and later plots from Jayton, Texas (Fig. 6b), Haviland, Kansas (Fig. 6c), and Purcell, Oklahoma (Fig. 6d) generally showed 20-45 kt strengthening of the flow in the 4-10 km layer from mid-morning over eastern New Mexico to late afternoon over western and central Oklahoma. Thereafter, the passage of a speed maximum in the 4-10 km layer over western Oklahoma was shown clearly by decreasing wind speeds in the 00-04 UTC 4 May profiler time series at Vici (Fig. 6e). The observed strengthening of the lower- and middle-tropospheric flow during the afternoon, generally below 8 km, indicated enhanced supercell potential based on simulations (e.g., Weisman and Klemp 1982; Wilhelmson and Klemp 1978). In conjunction with modest backing and strengthening low-level winds noted at Purcell, increasing middle- and upper-tropospheric winds resulted in sufficient deep-layered vertical shear for supercells by early afternoon in the warm sector (e.g., the shear term from the Bulk Richardson Number (BRN), after Weisman and Klemp 1982).


The velocity-azimuth display (VAD) wind profile from the Frederick, OK WSR-88D (Fig. 7a) revealed sufficient deep-layered vertical shear for supercells (e.g., BRN shear values around 55 m2 s-2) near the time and location of convective initiation. The hodograph was relatively straight through approximately 4 km (Fig. 7a) and supported both left and right-moving supercells based on observations and numerical simulations (i.e., Klemp and Wilhelmson 1978; Wilhelmson and Klemp 1978). Observed motions of the mature left and right splits associated with storm B (closer to Frederick than storm A) revealed 0-3 km storm-relative helicity (SRH) values near 120 m2 s-2 for the right-mover, and - 46 m2 s-2 for the left-mover. Farther east at Purcell, the 0-6 km shear magnitude increased from about 25 m s-1 (48 kt) at both 18 UTC (not shown) and 23 UTC 3 May (Fig. 6d), to 30 m s-1 (57 kt) by 02 UTC 4 May (Fig. 7b). BRN shear values also increased from 62 m2 s-2, to 123 m2 s-2, to 166 m2 s-2 at Purcell at these same times, respectively. Hodographs derived from the Purcell winds yielded a dramatic increase in 0-3 km SRH values from roughly 80 m2 s-2 at 18 UTC to 338 m2 s-2 by 23 UTC (Fig. 6d). Calculated SRH values at 23 UTC were based on the observed motion of storm A from 235 degrees at 12 m s-1 (23 kt) and the surface wind from 140 degrees at 8 m s-1 (15 kt) at Purcell. The SRH values from the Purcell profiler were also in close agreement with those calculated from the 00 UTC Norman sounding (Fig. 5), and the VAD wind profile from the nearby Twin Lakes WSR-88D (Fig. 15). The hodographs assumed pronounced clockwise curvature, all of which strongly favored right-moving supercells. The large temporal variability in SRH during the late afternoon hours was similar to that noted in previous studies of tornadic supercell environments by Davies-Jones (1993) and Markowski et al. (1998, hereafter M98). After the increase from mid-to-late afternoon, SRH values across central Oklahoma remained in the range of 350-400 m2 s-2 through the early evening for the observed right-moving supercell motions to the northeast at approximately 13 m s-1 (25 kt, Fig. 7b).


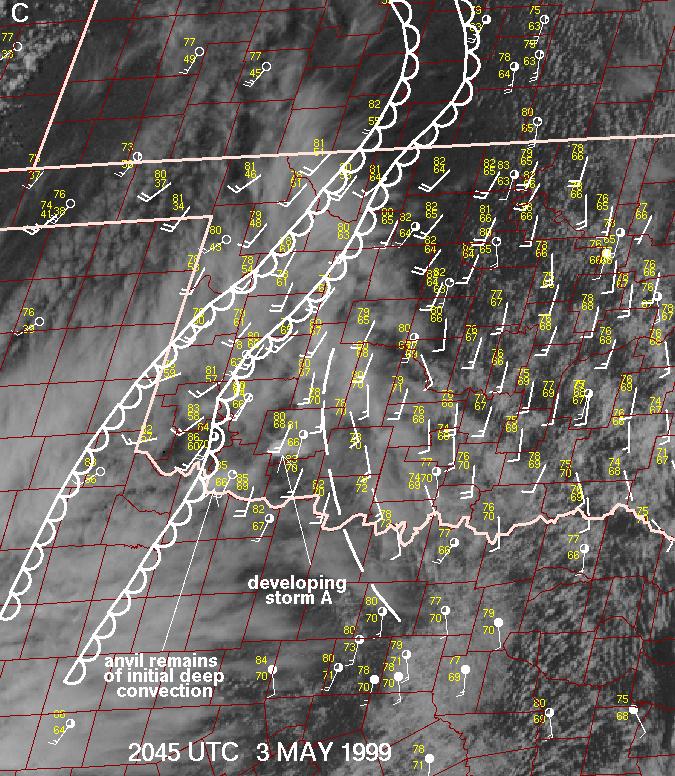
All supercells were preceded by the development of two short-lived convective towers over northwestern Texas. This convection formed under a relative gap in the cirrus canopy and between the surface drylines. The initial area of cumulus is shown in Fig. 8a, and the more substantial of these towers is noted in Fig. 8b. The cirrus gap shifted northeastward across southwestern Oklahoma, wherein additional towering cumulus formed southwest of Lawton around 2030-2045 UTC (Fig. 8c). This convection rapidly evolved into a storm split and the first right-moving supercell, storm A in Fig. 1a. Storm B developed explosively within a small cluster of updrafts west of Altus around 2115-2130 UTC (Fig. 8d), just west of the eastern dryline. Figure 8e shows storm A as it moved across the confluence boundary about 20 minutes prior to the first significant tornado of the outbreak, and as the right split of storm B developed mature supercell characteristics. These two storms were the most prolific tornado-producers of the outbreak with a combined total of 35, including the F5 tornado that moved across the southern Oklahoma City metropolitan area and an F4 tornado that hit Abell and Mulhall. All mention of supercells hereafter refers to the right-moving storms of the 3 May 1999 outbreak


Other damaging tornadic supercells developed south and west of Oklahoma City around 0030 UTC. Storm D tracked from Purcell to Stroud (Fig. 1), resulting in F3 tornado damage in Stroud around 0330 UTC, while storm E produced a tornado with F4 damage in Dover at about 0230 UTC. Storm D appeared to form near the southeast-northwest oriented confluence line to the southwest of Purcell, while storm E formed near the intersection of the confluence line and the eastern dryline. Another supercell (storm K) produced a violent tornado on the south side of Wichita, Kansas around 0130 UTC (Fig. 1).
The central Oklahoma thunderstorms displayed the visual characteristics of classic supercells (e.g., Lemon and Doswell 1979): large, striated updrafts well-removed from the main precipitation core, rotating wall clouds with associated clear slots, and thin precipitation curtains wrapping around the west side of the low-level mesocyclones. Pictures of these storms (Fig. 9) clearly illustrate the classic supercell storm structures. Storm A and storm B each had laminar cloud structures in the low levels, indicating forced ascent of parcels through the layer of convective inhibition over central Oklahoma noted in the unmodified 00 UTC 4 May OUN sounding (northeast of where storms A and B developed).


Storms A and B each were tornadic periodically for 4-6 hours. Each appeared to reach a state of balance with its environment, during which it was neither detrimentally outflow-dominant nor -deficient. Visual observations, video, and photographs of the Oklahoma tornadic supercells by the authors and others, along with radar reflectivity and velocity signatures, indicated they maintained classic (CL) precipitation distributions about the updraft and forward-flank regions once each storm evolved to its tornadic phase. Indeed, storm-relative winds of 21 m s-1 in the 9-11 km layer were supportive of classic supercells (see Fig. 6d), in agreement with the findings of Rasmussen and Straka (1998). During the first 1 to 1.5 hrs of storms A, E, and G, and the first 2 hrs of storm B, the storms exhibited visually skeletal cloud structures which observers often associate with low-precipitation (LP) supercells; but radar imagery actually revealed CL precipitation patterns. Figure 9 shows visual and radar 0.5o elevation reflectivity aspects of the supercells discussed.
Storms A and B each were characterized through the majority of their existence by horizontally enlarging and lowering updraft bases with time, and several episodes of multiple tornadoes within a single mesocyclone. Characteristic of many tornadic supercells (Lemon and Doswell 1979), relatively low cloud bases in the regions of strongest apparent low-level rotation and clear slots wrapping cyclonically around the wall clouds were observed almost constantly in storms A and B between the initial tornadic stages and darkness (about 3 hrs).
Cloud base heights appeared to lower as each storm passed northeastward over progressively smaller surface dew point depressions shown in mesonet data. Similar trends in lifted condensation level (LCL) evolution were found when using surface observations to modify 18 UTC 3 May and 00 UTC 4 May observed OUN soundings (Fig. 5), and soundings derived from gridded RUC-2 model output (not shown). The largest and most damaging tornadoes occurred after the lowering of the LCLs from roughly 1300 m at 20 UTC where storm A developed in southwestern Oklahoma, to less than 500 m in the Oklahoma City area by 00 UTC. The region of lower LCLs also coincided with the region of largest SRH east of the subtle confluence boundary in Oklahoma. This conforms to the findings of Rasmussen and Blanchard (1998), whose database of significant tornadic supercells (F2 or greater damage) had lower LCLs in aggregate than both other supercells and non-supercell thunderstorms. This also conforms to the trend toward increasing tornado threat as SRH increases, as noted by Davies-Jones (1993).
Structures of the other supercells were generally consistent with the observations of storms A and B, though darkness limited visibility of storm structures to those illuminated by lightning, and most observers were concentrated in proximity to the initial supercells.
Some aspects of the evolution of the troposphere followed a typical sequence of events preceding a severe thunderstorm outbreak: steep mid-level lapse rates overspread the area, boundary layer moisture increased, and daytime heating further increased instability. In these regards, 3 May 1999 resembled a “synoptically-evident” severe weather episode as originally defined by Doswell et al. (1993). However, anticipation of a major tornado outbreak was hindered by poor operational model forecasts of wind speeds in the middle and upper troposphere, and associated vertical shear parameters, over portions of the West Coast and southern Plains (Fig. 10).


Large-scale pattern recognition, based on numerical model forecasts, did not necessarily suggest a major tornado outbreak would ensue the evening of 3 May 1999. The perceived problems with the pattern were derived from operational model forecasts of, at best, modest vertical wind shear (Fig. 11), and surface analyses which did not provide a clear focus for convective initiation. However, the combinations of large buoyancy (in observations and model forecasts), and vertical shear parameters derived from regional profiler data and soundings during the afternoon and evening of 3 May were consistent with other historical tornado outbreaks. To further illustrate this point, 00 UTC hodographs for OUN and OKC are compared in Fig. 12 for four violent tornado events in central and northern Oklahoma: 4 May 1999, 27 April 1991, 27 April 1984, and 23 May 1981. In each event, the sounding site was uncontaminated in the low levels by convective outflow, although thermal lapse rates on the 3 May sounding decreased as the radiosonde entered the anvil of Storm A at the 551 mb pressure level. Each sounding showed a deep layer of strong positive buoyancy (not shown), and the hodograph structures were remarkably similar in the lowest 3 km. Interestingly, each of the hodographs displayed a pronounced “kink” within the 1 to 1.5 km AGL layer, where a combination of weak veering with height and strong speed shear suddenly changed to strong veering with little speed change. This feature enhances storm-relative inflow in the boundary layer, and may be related to low-level mesocyclone intensity and associated tornado potential based on the results of model simulations by Wicker (1996).


Surface analyses revealed a dryline on the meso-alpha to synoptic scales, which appeared to be a diffuse double dryline structure in finer scale analyses over northwestern Texas and western Oklahoma by mid-afternoon on 3 May 1999 (Fig. 3). A deep surface low existed well to the northwest of Oklahoma. However, surface convergence along each 3 May dryline was ill-defined, and the moisture gradient was not particularly large across either dryline. Ziegler and Hane (1993) suggested that boundary layer convergence is critical for maintaining a pronounced moisture gradient across a dryline, as well as for thunderstorm initiation along it. In fact, the initial supercell developed about 50 km east of the easternmost surface dryline position (Figs. 3d and 8c). Also, a large plume of cirrus developed in the lee of the Rockies over eastern New Mexico by mid-morning on 3 May. The cirrus overspread much of the Texas Panhandle and western Oklahoma by early afternoon (Fig. 8a), and raised questions about continued heating and mixing in the boundary layer through mid afternoon. Small temperature decreases and dew point increases across the central and southern Texas panhandle from 20 to 22 UTC (Figs. 8b and 8e), combined with small temperature increases and dew point decreases farther north in the Oklahoma panhandle, indicated shadowing and weaker vertical mixing under the dense high cloud canopy across the Texas Panhandle. The widespread high clouds and lack of convergence in the dryline regions introduced considerable uncertainty regarding the timing and location of convective initiation. However, the gap in the cirrus appeared to be crucial in allowing continued surface heating and mixing to maintain weak enough capping for the initiation of both short-lived cumulonimbi in northwestern Texas and long-lived storms A and B in southwestern Oklahoma.
The 00 UTC OUN sounding, modified for surface mesonet observations in southwestern Oklahoma, showed little convective inhibition and a level of free convection (LFC) within 2 km of the ground. This thermodynamic profile suggested that relatively weak mesoscale lift may have been sufficient to initiate deep convection. Forecast fields from the operational Eta model runs at 12 UTC and 18 UTC 3 May showed divergence in the 300-200 mb layer and weak quasi-geostrophic forcing for ascent over western Oklahoma from 500-300 mb between 18 UTC 3 May and 00 UTC 4 May. The model also suggested weak ascent from 850-700 mb, although ascent over western and central Oklahoma may have been offset by the warming noted in this layer from 18 to 00 UTC at OUN. Upper-tropospheric divergence and possible weak inertial instability in the upper troposphere (Fig. 13) may have also contributed to a favorable environment for strong storm top divergence and sustained updrafts, perhaps similar to the arguments presented by Blanchard et al. (1998).

On a smaller scale, storm A appears to have formed near the updraft portion of a large horizontal convective roll (HCR) in the boundary layer. Though no cloud streets were observed in 1 km visible satellite imagery, the apparent HCR was denoted by a meridional band in 1.5o elevation base reflectivity data from the Frederick radar site; the radar site was located about 25 km west of where storm A began (Fig. 14). The fine line was oriented parallel to the boundary layer flow, and Wilson et al. (1994) have established coincidence between convective boundary layer updrafts and reflectivity fine lines in clear air mode. This feature conforms to radar and shear-based characteristics for HCRs established by Weckwerth et al. (1997), who also found that HCRs are sometimes not apparent as visible cloud streets. The depth of the feature (1400-1500 m above ground level) appeared to be within a few hundred meters of the LFC height derived from modified soundings (roughly 1700 m above ground level); therefore, an HCR updraft was a potential mechanism for convective initiation. While such a mode of thunderstorm formation may be common, the presence and depth of HCRs are difficult to anticipate and detect in an operational setting. Forecasts for convective initiation will necessarily have large uncertainty when HCRs or other subtle boundary layer processes dominate, given the sensitivity of moist convection to temperature and moisture in the boundary layer (e.g., Crook 1996).

Finally, visible satellite imagery revealed a series of billow clouds oriented meridionally over northern Texas and south-central Oklahoma (Fig. 8a), to the east of where storms A and B developed. These clouds were associated with a relatively shallow, capped boundary layer with backed surface winds compared to northwestern Texas and southwestern Oklahoma. As the southwestern Oklahoma storms approached central Oklahoma, they encountered the confluent zone and associated backed surface winds, which yielded 0-3 km SRH values of 300-400 m2 s-2 (Figs. 6d and 7b). Both storms A and B produced brief tornadoes near and west of the subtle confluence boundary, but tornadoes became more numerous and progressively more intense as the storms moved through the region of increased SRH and lower LCL heights to its east. The air mass in this region, which coincided with the location of the billows prior to being obscured by high clouds, still contained surface-based CAPE values in excess of 3000 J kg-1. However, the longevity of the storms after 00 UTC was in question operationally because of the stronger cap well east of the confluence boundary. Indeed, storm A ceased producing tornadoes by 0130 UTC (less than an hour after devastating the southern Oklahoma City area), and dissipated shortly after 02 UTC (see Fig. 9e). To complicate matters further, storm D reached peak intensity only 30 miles south of where storm A dissipated. These observations underscored the difficulties faced by forecasters in anticipating storm longevity and tornado production in an evolving environment with subtle, but important variations.
The tendency of storms A and B to produce significant tornadoes after crossing the surface boundary appears to be consistent with the observations of M98, although the confluence boundary in this case was subtle, even in the relatively dense Oklahoma mesonet surface observations. Another storm-boundary interaction occurred farther north, when the Wichita supercell (storm K) crossed a boundary marked by a westward-moving band in 0.5o elevation reflectivity data, thereafter producing a violent tornado.
At least two possible cases of destructive storm interference were observed during the tornado outbreak, namely with storms D and K. The Wichita supercell (storm K) weakened substantially after being overtaken by a large area of thunderstorms from the southwest, while the Purcell-Stroud supercell (storm D) also was structurally altered by convection that formed and merged with the supercell from the southwest. Trends in radar imagery suggested that storm D evolved in a manner quite similar to the other violent tornadic supercells in central Oklahoma until the disruption of its classic structure by the merging precipitation areas.
In addition, not all wind profile parameters were strongly supportive of classic supercells with major tornadoes. A model-forecast weakness in storm-relative winds in the mid troposphere was seen as a potential limiting factor for significant tornadoes at the onset of the outbreak. It has been suggested by Brooks et al. (1994) and Thompson (1998) that weak storm-relative winds in the mid troposphere can lead to excessive cold outflow generation in the rear flank region of a supercell. This cold outflow can then undercut the mid-level mesocyclone prior to the formation of significant tornadoes, if not balanced by sufficiently strong storm inflow. Both the Purcell profiler at 23 UTC 3 May and the Norman sounding at 00 UTC 4 May revealed storm-relative winds in the 4-6 km layer that appeared to be marginal for sustained supercells with significant tornadoes (after Thompson 1998). However, actual wind speeds in the 3-6 km layer increased from 17 to 25 m s-1 (about 35 to 50 kt) between 23-02 UTC at Purcell, and corresponding 4-6 km storm-relative winds increased from 8 to 17 m s-1 (about 15 to 35 kt) by 02 UTC (Fig. 7b). Storm-relative winds derived from the Twin Lakes WSR-88D VAD wind profile, located about 15 miles north-northeast of the Purcell profiler, also were similar to those from Purcell. The severity of the 3 May tornado outbreak tended to increase in conjunction with increasing mid- tropospheric storm-relative flow at the Purcell profiler site from 23-02 UTC, and as multiple supercells encountered the region of enhanced SRH to the northeast of the subtle confluence boundary.
Interestingly, the wind profiles from the Purcell profiler, the Norman sounding, and the Twin Lakes radar site all conformed to common “proximity” standards for storm A (e.g., Darkow 1969; Brooks et al. 1994). However, storm A was located 25 miles or more to the west of these sites until about 2330 UTC and, therefore, somewhat closer spatially to the intensifying flow fields observed at Tucumcari and Jayton earlier in the day. A dramatic short-term increase in vertical wind shear and storm-relative winds also was indicated by the Twin Lakes WSR-88D VAD wind profile from 2348 UTC 3 May to 0018 UTC 4 May (Fig. 15), as storm A approached and passed only 10 km northwest of the radar site. This observation supports simulations by Weisman et al. (1998), which yielded 0-6 km shear perturbations of 8 m s-1 (about 15 kt) or more extending nearly 30 km ahead of a supercell for hodographs comparable to those observed in central Oklahoma. The general increase in wind speeds and vertical shear during the period 23-02 UTC, as well as the potential influence of storm A on the Twin Lakes VAD wind profile, suggest that there may not have been a single wind profile that correctly characterized the environment of storm A.
The 3 May 1999 event in Oklahoma showed some general large-scale characteristics of historical severe thunderstorm outbreaks in the southern and central Plains. A mean trough was located over the Four Corners area with a deep high Plains surface low and an unstable warm sector. An embedded mid- to upper-tropospheric jet streak moved east-northeastward from the mean trough during the afternoon of the outbreak. However, the embedded jet streak was not resolved well by the operational models prior to the outbreak, and surface convergence in proximity to the drylines was ill-defined through the afternoon. Additionally, a large area of high clouds overspread the drylines and warm sector during the afternoon, which complicated forecasts of convective initiation.
There are several important points to be learned from the 3 May outbreak. First, this event illustrates that outbreaks of strong and violent tornadoes are not necessarily associated with what many operational forecasters would consider to be the most evident large-scale patterns in numerical model output. While the potential for a severe weather episode was anticipated by Storm Prediction Center forecasters a day in advance, a major tornado outbreak was not forecast initially for 3 May 1999. Much of the difficulty in anticipating the magnitude of the tornado threat 12-24 hrs in advance was the result of poor numerical model forecasts of mid- and upper-tropospheric flow, and associated deep-layered vertical shear. However, observational data suggested a substantially greater and increasing threat of supercells with significant tornadoes, based on parameters derived from surface analyses and profiler data from mid-morning to early evening on 3 May 1999. Previous May-June events in the Plains with strong and violent tornadoes have been characterized by large CAPE values (3000-5000 J kg-1) and sufficient vertical shear for supercells (e.g., 0-6 km shear magnitudes in excess of 20 m s-1, BRN shear greater than 40 m2 s-2, and 0-3 km SRH values of 150-300 m2 s-2), based on standard observations. The truncated 00 UTC 4 May OUN sounding yielded 0-2 km SRH and lowest 100 mb mean CAPE values that fell well within the distributions presented by Johns et al. (1993) for other strong and violent tornadoes. So did the same parameters derived from soundings modified to represent (to the best of observational ability) near-storm conditions less than an hour prior to the formation of the initial supercell in the 3 May outbreak (Fig. 16).

Between its development and violent tornado production, storm A appeared to shift markedly from the high-CAPE and low-shear extreme of the Johns et al. (1993) diagram toward the mid-range of the parameter space (Fig. 16). Also, the kinematic observations in central Oklahoma from 23-02 UTC suggested that storm characteristics may not always be predictable, especially when the mesoscale storm environment is changing with time. This problem is compounded when a storm simultaneously affects nearby observations as evident in the Twin Lakes VAD wind profile data just after 00 UTC (Fig. 15), i.e., when the storm’s influence may be superimposed on changes in the background wind profile. This illustrates the need for operational forecasters and researchers alike to consider the CAPE-shear parameter space for any given thunderstorm as fluid with respect to time, not static. The concept of significant, deep-tropospheric environmental evolution throughout an individual storm’s lifetime should become a fundamental inclusion in storm-scale numerical modeling studies of supercells.
When forecasting a threat of tornadoes, the mode of convective initiation and the number and spacing of supercells that form are critical to the number of tornadoes expected. In the same mesoscale region, several supercells may develop in association with different forms of boundaries. These boundaries vary in detectability when using conventional data sources, and storms may form where there are no apparent boundaries. The initial storms in the 3 May 1999 outbreak evolved into tornadic supercells that each lasted several hours, with no early transition to a squall line or other convective mode. Storm spacing and motions were such that the supercells remained in an environment of favorable vertical shear and instability for several hours without numerous storm collisions, thus allowing the supercells to produce a large number of tornadoes.
The predominance of a supercell convective mode and lack of a squall line on 3 May 1999 may have been attributable to the lack of strong low-level convergence near the dryline(s). It is conceivable that the outbreak would not have materialized in such intense or prolific form had the convergence been stronger along a consolidated dryline, and had numerous storms formed simultaneously and merged into a larger-scale convective system in the weakly capped environment over northwestern Texas and western Oklahoma during the afternoon. However, on forecast times greater than mesoscale, that same lack of convergence in the area of drylines suggested that supercells might not develop at all, consistent with the ideas of Ziegler and Hane (1993). This presented a major forecasting challenge in two ways: 1) narrowing the spatial threat for supercell concentration on the synoptic time scale (roughly 12-h or more), and 2) diagnosing and nowcasting subtle mesoscale features not associated with distinct thermodynamic discontinuities (such as fronts, singular drylines, outflow boundaries, etc.).
In this case, subtle clues/precursors to storm initiation were present primarily in high-resolution visible satellite imagery (e.g., the cumulus towers beneath the cirrus hole), and nearby WSR-88D data (e.g., the possible HCR). The complex dryline, confluence zone, and HCR structures identified during this event each demonstrate the importance of high-resolution, lower-tropospheric observational data to the real-time diagnosis of subtle boundaries and their subsequent effects on storm initiation and organization. As illustrated in our analyses and in another complex dryline case (Brooks et al. 1995), output from observing systems of coarser spacing, including the conventional network of surface reporting stations, may be insufficient to resolve such features. Even in the presence of mesoscale surface observations, forecasters also may need to rely on careful interpretation of available satellite and radar imagery to recognize small areas where convective initiation is possible.
A majority of significant tornadoes during the 1995 version of the Verification of the Origins of Rotation in Tornadoes EXperiment (VORTEX-95) occurred in association with surface boundaries (M98). Furthermore, recent numerical simulations indicated strong relationships between mesocyclone intensity and longevity, and the baroclinic strength and orientation of low-level boundaries (Atkins et al. 1999). However, low-level baroclinic boundaries were either ill-defined or not present during the 3 May outbreak. This illustrates that the apparent weakness or absence of such boundaries in the warm sector does not preclude significant tornadoes, given the initiation of supercells in an otherwise highly favorable environment characterized by large CAPE, strong deep-layered vertical shear (e.g., 0-6 km shear or BRN shear), and strong low-level shear (e.g., 0-3 km SRH). Still, the roles of a wide variety of pre-existing boundaries in convective initiation and tornadogenesis, including weakly convergent drylines, HCRs, confluence axes, and various reflectivity patterns not evident in surface and satellite data, warrant much additional attention. Observations suggested that subtle boundaries were important to the initiation and evolution of several tornadic supercells in the 3 May outbreak, and it remains crucial for forecasters to monitor high-resolution data (namely WSR-88D, satellite, and profiler) to anticipate local areas of enhanced or diminished tornado threat.
Finally, the 3 May 1999 tornado outbreak exposed some problems in the application of recent supercell and tornado forecast techniques. Some forecasters at the Storm Prediction Center anticipated a possibility of HP supercells because of: 1) potential for storms to be seeded by adjacent storms, and 2) inaccurate model forecasts of weak mid- and upper-tropospheric flow and associated weak storm-relative winds. The idea of seeding by adjacent storms needs to be clarified as a general concept since, in this instance, the anvil of storm B substantially overlapped the main updraft of storm A while the latter maintained classic supercell structure. Applications of storm-relative flow to fixed levels and layers (e.g., RS98; Thompson 1998) are being re-examined by the authors in terms of variable storm depth normalized to vertical storm extent. It is also possible that the effects of mid- and upper-tropospheric storm-relative winds can counteract one another in a particular thermodynamic profile, a hypothesis which warrants examination.
Operational forecasts of supercell types and tornado potential will continue to be difficult for the foreseeable future, especially when the processes responsible for creating “favorable” supercell tornado environments occur on the mesoscale, or even storm-scale. Profiler and radar-derived wind data each greatly aid the short-term forecast process by providing time sampling between synoptic rawinsonde launches. However, many supercell type and tornado forecast parameters are sensitive to small changes (2-5 m s-1) in wind vectors and storm motion, which lends these parameters to misinterpretation. Still, the more general combinations of CAPE and vertical shear clearly supported tornadic supercells by the late afternoon and evening of 3 May 1999. This suggests that the background environment, as opposed to just storm-scale variations, can be a dominant controlling factor in regional tornado outbreaks.
Acknowledgments The authors are grateful to many colleagues at SPC for insights offered during discussions of this tornado outbreak, and for their internal reviews of this work. The careful and thought-provoking comments from two anonymous reviewers resulted in valuable additions to the manuscript. This work also benefitted from discussions with Chuck Doswell, Erik Rasmussen, and Dave Schultz (NSSL), Jim LaDue (OSF), and Dan Miller (NWS Norman). Mike Vescio (SPC) assisted with Fig. 9, Dave Schultz (NSSL) created Fig. 13, and Bob Johns provided most of Fig. 16. We appreciate the photographic documentation of many storm observers whose imagery greatly aided our assessment of supercell character and morphology. Finally, we commend the Science Support Branch of the SPC for providing easy access to the 3 May data archive.
Atkins, N. T., M. L. Weisman, and L. J. Wicker, 1999: The influence of preexisting boundaries on supercell evolution. Mon. Wea. Rev., 127, 2910-2927.
Blanchard, D. O., W. R. Cotton, and J. M. Brown, 1998: Mesoscale circulation growth under conditions of weak inertial instability. Mon. Wea. Rev., 126, 118-140.
Brooks, H. E., C. A. Doswell III, and J. Cooper, 1994: On the environments of tornadic and nontornadic mesocyclones. Wea. Forecasting, 9, 606-618.
_____, _____, E. N. Rasmussen, and S. Lasher-Trapp, 1995: Detailed observations of complex dryline structure in Oklahoma on 14 April 1994. Preprints, 14th Conf. on Wea. Analysis and Forecasting, Dallas, TX, Amer. Meteor. Soc., 62-67.
Brock, F. V., K. C. Crawford, R. L. Elliott, G. W. Cuperus, S. J. Stadler, H. L. Johnson, and M. D. Eilts, 1995: The Oklahoma Mesonet: A technical overview. Crook, N. A., 1996: Sensitivity of moist convection forced by boundary layer processes to low-level thermodynamic fields. Mon. Wea. Rev., 124, 1767-1785.
Darkow, G. L., 1969: An analysis of over sixty tornado proximity soundings. Preprints, 6th Conf. on Severe Local Storms , Chicago, IL, Amer. Meteor. Soc., 218-221.
Davies-Jones, R. P., 1993: Helicity trends in tornado outbreaks. Preprints, 17th Conf. on Severe Local Storms, St. Louis, MO, Amer. Meteor. Soc., 56-60.
Doswell, C. A. III, 1982: The operational meteorology of convective weather. Vol. I: Operational mesoanalysis. NOAA Tech. Memo. NWS NSSFC_5. NTIS Accession No. PB83_162321, 158 pp.
_____, S. J. Weiss, and R. H. Johns, 1993: Tornado forecasting – a review. The Tornado: Its Structure, Dynamics, Prediction, and Hazards. Geophys. Mongr., 79, Amer. Geophys. Union, 557-571.
_____, and E. N. Rasmussen, 1994: The effect of neglecting the virtual temperature correction on CAPE calculations. Wea. Forecasting, 9, 625-629.
Johns, R. H., J. M. Davies, and P. W. Leftwich, 1993: Some wind and instability parameters associated with strong and violent tornadoes. Part II: Variations in the combinations of wind and instability parameters. The Tornado: Its Structure, Dynamics, Prediction, and Hazards. Geophys. Mongr., 79, Amer. Geophys. Union, 583-590.
Klemp, J.B., and R.B. Wilhelmson, 1978: Simulations of right- and left-moving storms produced through storm splitting. Lemon, L. R., and C. A. Doswell III, 1979: Severe thunderstorm evolution and mesocyclone structure as related to tornadogenesis. Mon. Wea. Rev., 107, 1184-1197.
Markowski, P. M., E. N. Rasmussen, and J. M Straka, 1998: The occurrence of tornadoes in supercells interacting with boundaries during VORTEX-95. Wea. Forecasting, 13, 852-859.
Rasmussen, E. N., and D. O. Blanchard, 1998: A baseline climatology of sounding-derived supercell and tornado forecast parameters. Wea. Forecasting, 13, 1148-1164.
_____, and J. M. Straka, 1998: Variations in supercell morphology. Part I: Observations of the role of upper-level storm-relative flow. Mon. Wea. Rev., 126, 2406-2421.
Schaefer, J. T., 1974: The life cycle of the dryline. J. Appl. Meteor., 13, 444-449.
Speheger, D.A., Doswell, C.A. III, and G.J. Stumpf, 2001: The tornadoes of 3 May 1999: Event verification in central Oklahoma and related issues. Wea. Forecasting, in review.
Thompson, R. L., 1998: Eta model storm-relative winds associated with tornadic and nontornadic supercells. Wea. Forecasting, 13, 125-137.
U. S. Department of Commerce, 1999: Storm Data, 41 (5). [Available from National Climatic Data Center, Asheville, NC 28801.]
Weckwerth, T. M., J. W. Wilson, R. M. Wakimoto, and N. A. Cook, 1997: Horizontal convective rolls: Determining the environmental conditions supporting their existence and characteristics. Mon Wea. Rev., 125, 505_526.
Weisman, M. L., M. S. Gilmore, and L. J. Wicker, 1998: The impact of convective storms on their local environment: What is an appropriate ambient sounding? Preprints, 19th Conf. on Severe Local Storms , Minneapolis, MN, Amer. Meteor. Soc., 238-241.
_____, and J. B. Klemp, 1982: The dependence of numerically simulated convective storms on vertical wind shear and buoyancy. Mon. Wea. Rev., 110, 504-520.
Wicker, L. J., 1996: The role of near surface wind shear on low-level mesocyclone generation and tornadoes. Preprints, 18th Conf. on Severe Local Storms , San Francisco, CA, Amer. Meteor. Soc., 115-119.
Wilhelmson, R. B., and J. B. Klemp, 1978: A numerical study of storm splitting that leads to long-lived storms. J. Atmos. Sci., 35, 1974-1986.
Wilson, J. W., T. M. Weckwerth, J. Vivekanandan, R. M. Wakimoto, and R. W. Russell, 1994: Boundary layer clear_air radar echoes: Origin of echoes and accuracy of derived winds. J. Atmos. Oceanic Technol., 11, 1184_1206.
Ziegler, C. L., and C. E. Hane, 1993: An observational study of the dryline. Mon. Wea. Rev., 121, 1134-1151.