JUNE 29, 2012 DERECHO
"The Ohio Valley / Mid-Atlantic Derecho of June 2012"
While not the most intense or long-lived
event ever observed, the June 29, 2012 Ohio Valley / Mid-Atlantic Derecho was noteworthy in producing the all-time highest
recorded June or July wind gusts at several official observing sites along its path (Fort Wayne, Indiana, Zanesville,
Ohio, and Huntington, West Virginia), in addition to widespread, significant wind damage. Five million people lost power
from Chicago to the mid-Atlantic Coast, and 22 people were killed. The storm also was notable for being arguably the first
derecho to capture widespread media attention, striking as it did nearly every metropolitan area in a broadening path
that extended from Chicago and Indianapolis to Baltimore, Washington, and Tidewater Virginia (Figures 1 and 2).
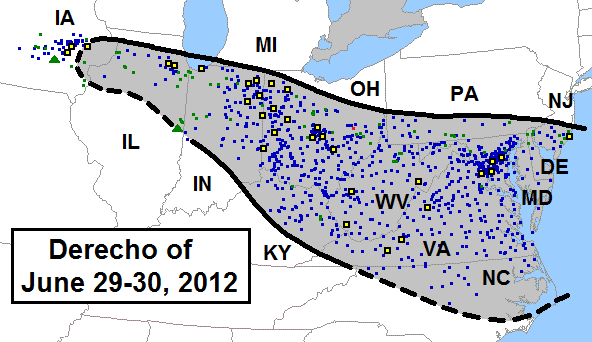
Figure 1. Area affected (black contours) and storm reports (colored symbols) associated with the June 29, 2012 derecho. Reports are for the 24-hour period from 7:00 a.m. CDT (1200 UTC) Friday, June 29 to 7:00 a.m. CDT (1200 UTC) Saturday, June 30. Areal outline dashed in Iowa and Illinois to reflect the derecho's origin from convection in that region that did not immediately produce continuous derecho-like conditions. In addition, some of the reports in those states occurred not with the system here discussed, but rather with a subsequent storm complex that formed on the evening of June 29 (see Figures 3, 4, and 5). The areal outline also is dashed in North Carolina to reflect that many of the damaging wind gusts in that state occurred south of the thunderstorms that produced them. Storm reports depicted as follows: Wind damage or wind gusts ≥ 50 kts (58 mph), small blue squares; estimated or measured wind gusts ≥ 65 kts (74 mph), large black squares with yellow centers; hail ≥ 0.75 inches, small green squares; hail ≥ 2.0 inches, large green triangles; tornadoes, small red squares.
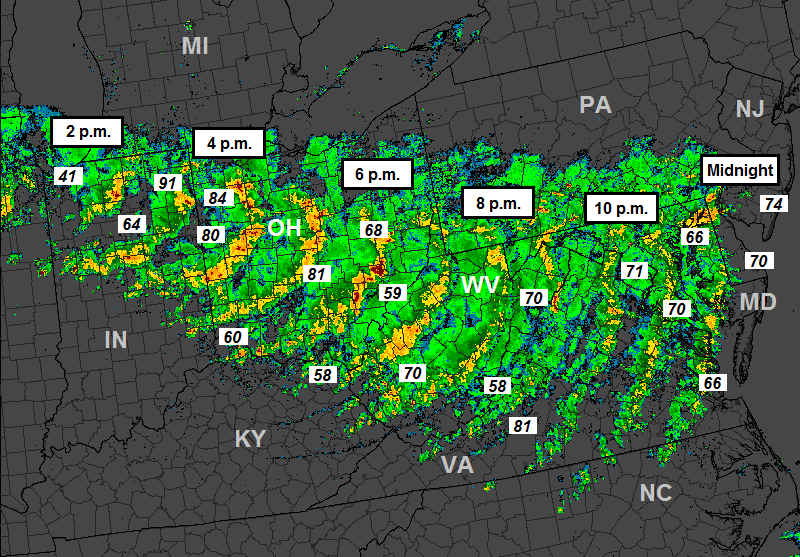
Figure 2. Composite display of hourly radar reflectivity imagery, showing development and evolution of the June 29, 2012 derecho-producing convective system, with selected observed wind gusts (italics, mph). Time is EDT, and ranges from 2 p.m. Friday, June 29 (1800 UTC June 29; far left) to 12:00 midnight Friday-Saturday, June 29-30 (0400 UTC June 30; far right). The derecho moved approximately 700 miles in twelve hours, yielding an average motion of nearly 60 mph. (Modified from base image by G. Carbin, NOAA Storm Prediction Center)
As with a sizable percentage of warm-season events, the parent convective system associated with the Ohio Valley /
Mid-Atlantic derecho arose from elevated thunderstorms; that is, storms that formed in a layer of unstable air located
above a frontal surface. In this case, the storms formed during the early morning (CDT) of Friday, 29 June over eastern
Iowa, where a modest band of moist, southwesterly low-level winds (known as the "nocturnal low level jet") intersected
a weak stationary front. The front extended east into central Ohio and southern Pennsylvania, and served, in part, as
a guide along which the derecho would move later in the day. The boundary separated hot, very humid air (with afternoon
temperatures near 100 °F and surface dewpoints around 70 °F) from slightly cooler and drier air to the north (Figure 3).
Despite the absence of an upper level (or "jet stream") disturbance to encourage development, the Iowa thunderstorms
grew and developed east into northern Illinois through the remainder of the morning as the moist southwesterly flow
continued to impinge on the front. Storm development and intensity were enhanced by the presence of a deep "elevated mixed
layer," or EML, across the region (see Derechos and Heat Waves). The EML extended all
the way from the Rockies and northern Plains through the mid-Mississippi and Ohio Valleys to the mid-Atlantic coast --- well beyond
its usual range over the Plains. The eastward extension of the EML reflected the presence of persistent, deep westerly flow on
the north side of a stationary high pressure area centered over the southern states. The high was responsible for a
protracted heat wave that gripped the southern Plains, Ohio Valley, and Southeast in the days prior to the 29 June derecho.
On the 29th, several sites, including Charlotte, Nashville, and Raleigh tied or set all-time June maximum temperature records
(with readings of 104, 109, and 105 (°F), respectively). In Washington, D.C., the maximum of 104 was the hottest ever observed
in June in 142 years of record. (For more on the general the relationship between derechos and heat waves,
see Derechos and Heat Waves).
The Iowa and Illinois storms produced scattered instances of severe hail and damaging wind, including 60 mph gusts near
Chicago, but were not otherwise noteworthy. By early afternoon, however, the convection strengthened as it moved into northern
Indiana. While these thunderstorms likely were still slightly elevated above the frontal surface, they nevertheless began to
"bow" downstream toward Fort Wayne, producing swaths of 60-70 mph winds that toppled numerous trees and power lines. Around
the same time, new storms began to form farther south across central Indiana as surface heating destabilized the region along
the stalled front and allowed the EML "cap" (or "lid") to be breached (Figure 3).
Figure 3. Fourteen-hour visible data satellite loop showing the development and evolution of the June 29, 2012 derecho-producing convective system, and of smaller convective system that subsequently formed over Iowa and Illinois (responsible for some of the severe weather reports in that region plotted in Figure 1). "Ping-pong" animation begins at 6:25 a.m. CDT (1125 UTC) June 29 and ends at 9:10 p.m. EDT June 29 (0110 UTC June 30). Surface data also shown, using conventional format with standard three-letter station identifiers (temperature / dew point (°F) on left, pressure / pressure tendency (mb) on right; white lines / barbs depict wind direction and speed (knots; one full barb = 10 knots = 11.5 mph)). Return leg of loop pauses at 2:15 p.m. EDT (1815 UTC), shortly before storms evolved into a derecho-producing convective system. This is to highlight concentrated area of convective overturning that is about to occur over central and eastern Indiana as outflow boundary from northern Indiana bow encounters field of rapidly growing cumulus congestus clouds (speckled area) in central Indiana and western Ohio. Such concentrated, nearly simultaneous, deep convective development often immediately precedes derechos that occur in the absence of strong, large-scale forcing for ascent (i.e., in the absence of an obvious jet stream disturbance).
The combination of hot, very humid air at the surface with temperatures that decreased rapidly with height ("steep lapse rates")
in the overlying EML fostered vigorous storm updrafts. As a result, the convection expanded rapidly east along the front to
join the strengthening bow as the latter feature entered Ohio from northeast Indiana. By 4 p.m. (EDT), this concentrated release
of great thermodynamic instability yielded an intense squall line that arced from south of Toledo, Ohio through the Dayton area
to near Indianapolis. Scattered 80 mph gusts in the evolving derecho not only downed countless trees and power lines, but also
blew roofs off homes, businesses, and schools, and overturned tractor-trailers. Several people were injured by falling trees and
wind-blown debris. A measured 91 mph gust at Fort Wayne was the strongest wind gust ever observed at that first-order
observing site during June and July in 61 years of record.
The derecho-producing squall line accelerated east-southeast across central and southern Ohio through the remainder of the
afternoon and early evening, reaching northern Kentucky and western West Virginia by 7:00 p.m. It was over the southern half
of Ohio that the storm system attained its greatest organization and strength (Figure 4). Tree damage became widespread as the
swath of high winds broadened and became nearly continuous, with numerous measured severe gusts observed. An all-time June-July record
wind gust of 63 mph was recorded at Zanesville. Structural damage prompted the closing of a shopping mall in Dayton, and
a 70-year-old woman was crushed by a collapsing barn near Zanesville. In neighboring Kentucky, a falling tree killed a man in
Clark County (east of Lexington).
During this period, the apex of the system's larger-scale bow tracked east-southeast along the aforementioned stationary front
over central Ohio with an average speed of more than 65 mph (Figure 4). The motion of the bow apex along the front appeared, in part,
to reflect augmentation of the bow by its absorption of thunderstorms that formed ahead of it along the boundary. Similar
behavior has been observed with less notable bowing convective systems. The bow's link with the boundary also reflected
the change in the direction and speed of cell advection and propagation that existed from north to south across the boundary.
Relatively fast eastward propagation was favored north of the front, with slower south or southeastward development to its
south.
Figure 4. Eighteen-hour composite radar base reflectivity loop showing development and evolution of the June 29, 2012 derecho-producing convective system, and of smaller convective system that subsequently formed over Iowa and Illinois. "Ping-pong" animation begins at 7:15 a.m. CDT Friday, June 29 (1215 UTC June 29) and ends at 2:40 a.m. EDT (0640 UTC) Saturday, June 30. Reflectivity intensity scale at left (dBZ). Surface data plotted using conventional format, as in Figure 3.
The derecho raced east across the mountains of West Virginia, western Virginia, far southwest Pennsylvania, and western Maryland
during mid-evening, where widespread destruction continued --- mainly to trees. Several people were killed or injured as trees
fell onto vehicles and homes. Although radar reflectivity data suggest that the storms slightly weakened during this period,
(Figure 4) they remained efficient wind producers. Wind damage occurred even along the far southern fringe of the squall line,
where little or no cloud-to-ground lightning was observed.
The convective system regained strength as it continued east and southeast of the Appalachians into central Virginia, northern North
Carolina, the District of Columbia, and central Maryland later in the evening (Figure 5). The north-south damage swath widened to nearly
300 miles, and more than dozen people were killed or seriously injured by falling trees. The derecho's effects were particularly
acute in suburban Washington and Baltimore, where measured 65-75 mph gusts severed numerous overhead electrical feeders. Two people
were electrocuted by downed power lines, and more than two million customers lost power. Power in some areas took nearly a
week to be restored. In addition, communication disruptions were widespread. Near Washington, D.C., loss of power to a key
communications facility interrupted 911 service in northern Virginia. Other communication issues involved the loss of both land line
and cellular telephone service, and scattered internet outages in the private, government, and commercial sectors. Some of these
problems persisted for several days.
Figure 5. Sterling, Virginia (near Dulles Airport)
radar reflectivity (left) and velocity (right) animations from 8:57 p.m. to 11:35 p.m. EDT June 29 (0057 - 0335 UTC June 30) as the derecho
moved from the Blue Ridge Mountains to the Chesapeake Bay. Small, dark circle in both loops marks the radar site west of Washington, D.C.
Reflectivity (dBZ) and velocity (knots) scales shown near top of each loop.
In the velocity display, cyan and green shades represent strong inbound winds; bright oranges and reds, strong outbound flow. The
loop well illustrates the veritable "wall of wind" associated with a strong derecho. However, while the apex of the large
scale bow echo did indeed cross Washington, D.C., the apparent drop-off in wind speeds north and south of the city is exaggerated
by the fact that Doppler radar can only detect the component of the wind blowing directly toward or away from the radar. (Base data
courtesy of R. Grumm, NWS State College, Pennsylvania).
By midnight EDT, the squall line extended in a broad arc from northeast of Baltimore to the Virginia-North Carolina border northeast
of Raleigh. Some of the damaging wind gusts observed in North Carolina occurred south of the parent thunderstorms that produced
them, attesting to the intensity and concentration of storm downdrafts near the Virginia-North Carolina border. Wind damage continued
as the convective system moved east across the Chesapeake Bay and the Delmarva Peninsula early Saturday morning (30 June). Several
measured gusts in the 60-70 mph range were reported in Tidewater Virginia and Delaware.
The northern end of the storm system strengthened as it moved into southern New Jersey. This appeared to occur as a larger scale
circulation (a mesoscale convective vortex, or MCV), evolved near the intersection of the
squall line and the remnant stationary front. The development of the MCV may, in part, have been related to a localized burst of intense
convection near Baltimore (apparent toward end of animation shown in Figure 5) that was accompanied by a notable increase in cloud-to-ground
lightning. The storms in this part of the convective system produced continuous damage that extended east across Delaware Bay to Atlantic City,
where a 74 mph gust was reported. Two children were killed at Parvin State Park in Salem County, New Jersey when a tree fell across their camping
tent. The derecho-producing system finally weakened upon encountering cooler, maritime air off the Delaware and New Jersey coast around 2 a.m.
Saturday (Figure 6).
Figure 6. Twenty-two-hour infrared data satellite loop showing the development, evolution, and demise of the June 29, 2012 derecho-producing convective system, and of smaller convective system that subsequently formed over Iowa and Illinois. "Ping-pong" animation begins at 6:30 a.m. CDT (1130 UTC) June 29 and ends at 5:15 a.m. EDT June 30 (0915 UTC June 30). Color enhancement scale not shown, but cloud tops colder than -65 °C appear black (approximately 14 km or 46,000 ft), -70 °C, gold (approximately 15 km or 50,000 ft), and -75 °C, aqua (approximately 16 km, or 53,000 ft). Loop pauses on selected frames that display 1200 UTC June 29 and 0000 UTC June 30 500 mb radiosonde data (using conventional station plot format, similar to that in Figure 3, with height in decameters).
The Ohio Valley / Mid-Atlantic derecho serves as a reminder that, when conditions are favorable --- in particular, when the Plains
elevated mixed layer extends well beyond its normal range --- significant, forward-propagating convective systems may move all the
way to the East Coast. The Appalachian Mountains frequently are cited as having a deleterious impact on convective systems moving
into the Mid-Atlantic states from the Midwest. It is true that terrain effects can negatively impact the low level wind and buoyancy
patterns that govern system propagation. But the primary reason many Midwest storm systems weaken upon reaching the Appalachians
is that, on average, that is where they encounter the eastern extent of the EML. In fact, it could be argued that the Appalachians
enhanced the 29 June 2012 event, as downslope flow within the convective system cold pool augmented low level ascent along
the gust front east of the mountains, enabling viable cell propagation to continue well into the night. While such events are
uncommon, they are by no means unprecedented.
In summary, the Ohio Valley / Mid-Atlantic Derecho of June 2012 traveled approximately 700 miles in twelve hours, with an average forward
speed of nearly 60 mph. The storm inflicted untold damage and hardship along a heavily populated corridor through the Midwest and Mid-Atlantic
states. Nearly two dozen people lost their lives, and many more were seriously injured. Many thousands suffered without power for days in the
life-threatening heat wave that persisted after the storm. The storm's impact, particularly on the Nation's Capital, garnered widespread media
attention. For the first time, perhaps, the word "derecho" was front-page news. The event, however, was not well forecast. The derecho illustrated
that widespread, significant weather conditions can, on occasion, occur in the absence of strong atmospheric disturbances
(see Derecho Forecasting). The storm also once again drew attention to the vulnerablity of
suburban areas to derecho winds due to their enhanced exposure to tree and utility line damage (see,
in Casualty and Damage Risks, "Special hazards posed by derechos in urban areas").
_____________________________________________________________________________
[S. Zubrick, NWS Baltimore-Washington, provided input on the impact of this event in the Baltimore-Washington area.]
Additional information:
Iowa Environmental Mesonet (IEM) - Iowa State University animated radar reflectivity and velocity view of June 29, 2012 derecho
Baltimore-Washington NWS Office - Overview of the June 29, 2012 derecho in the Maryland-Virginia area
Charleston, West Virgina NWS Office - Overview of the June 29, 2012 derecho in southeast Ohio and West Virginia
Northern Indiana NWS Office - Overview of the June 29, 2012 derecho in northeast Indiana and northwest Ohio
Wilmington, Ohio NWS Office - Overview of the June 29, 2012 derecho over central / southwest Ohio and northern Kentucky
NOAA Environmental Visualization Laboratory - Animated satellite view of June 29, 2012 derecho
Washington Post - Capital Weather Gang blog by Ian Livingston, July 3, 2012