SPC Hand Analysis Example
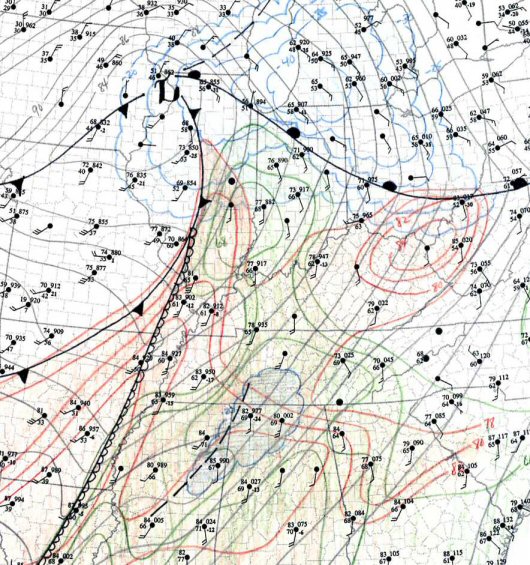
Despite the powerful computers, there is no substitute for drawing weather maps by hand for making a forecaster take the time to thoroughly understand the ongoing weather situation. And without knowing the intricate details of what's happening now, a forecast can suffer. So SPC forecasters routinely draw -- by hand -- surface and upper air features on printed maps, many times per day. This is a piece of a surface map containing lows and warm fronts (bright red), highs and cold fronts (blue), outflow boundaries (purple dash-dot), pressure troughs and isobars (dark gray), isotherms and warm spots for temperature (dark red), isodrosotherms and moist spots for dew point (green), a dryline (dark brown), and finally, snapshots of wind flow called streamlines (tan). It may look like a jumbled mess, bad food or abstract art; but to a severe storms meteorologist, it is stuffed with useful information.